
Welcome
CIO Vantage
A top-down view of markets and portfolios because you are the Chief Investment Officer.
Introduction: Asset Allocation
The 60/40 “Lazy Man” ETF Portfolio
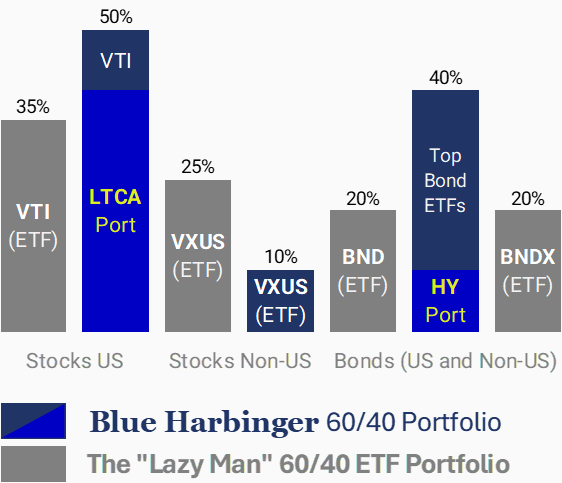
Asset allocation (i.e. how your money is distributed across broad categories, such as stocks, bonds, and real estate) is typically the number one driver of long-term investment performance (individual security selection and tax considerations are also major drivers), and one of the easiest ways to implement a conservative balanced asset allocation is the classic 60/40 balanced portfolio (60% stocks and 40% bonds) through a “lazy man” ETF approach.
For example, Vanguard’s four very popular low-cost ETFs (VTI, VXUS, BND and BNDX) are the basic building blocks for millions of default-path investment portfolios across the US. And not only is this a good asset allocation approach (because it gives instant diversification across major global investment markets, as well as low-fees, low trading costs, and long-term discipline), but it’s also a great benchmark, asset allocation framework, and starting point upon which investors can customize their own personal investment strategies to align with their own individual investment objectives through both asset allocation tilts (for example many investors tilt their portfolios toward even more stocks than bonds, and/or more US stocks than international) as well as security selection (such as the Blue Harbinger LTCA portfolio) within their individualized asset allocation targets (such as US stocks).
For illustration, the blue and gray bar chart image shows the classic 60/40 “lazy man” ETF portfolio (gray bars) and as compared to a Blue Harbinger 60/40 portfolio (using the BH LTCA portfolio, the BH High-Yield portfolio and select top bond ETFs) to implement thoughtful asset allocation tilts and customized security selection.
And worth mentioning, from a taxation standpoint, the types of investment accounts (e.g. Individual Retirement Accounts (IRAs), taxable brokerage accounts) in which you choose to implement your investment strategy matters a lot to your bottom line too.
Overall, this bar chart provides a powerful framework through which you can view and manage your own personalized investment strategy.
The Risk-Reward Tradeoff
Continuing with this asset allocation framework, the conventional wisdom is that bonds (such as those in the asset allocation illustration) are often viewed as being less risky in the short-term because they typically pay steady income and often exhibit lower price volatility, but the tradeoff is bonds may provide lower total returns (price appreciation plus income payments as if they were reinvested) in the long-term (and that’s where stocks can really shine—long-term COMPOUND growth—the eighth wonder of the world).
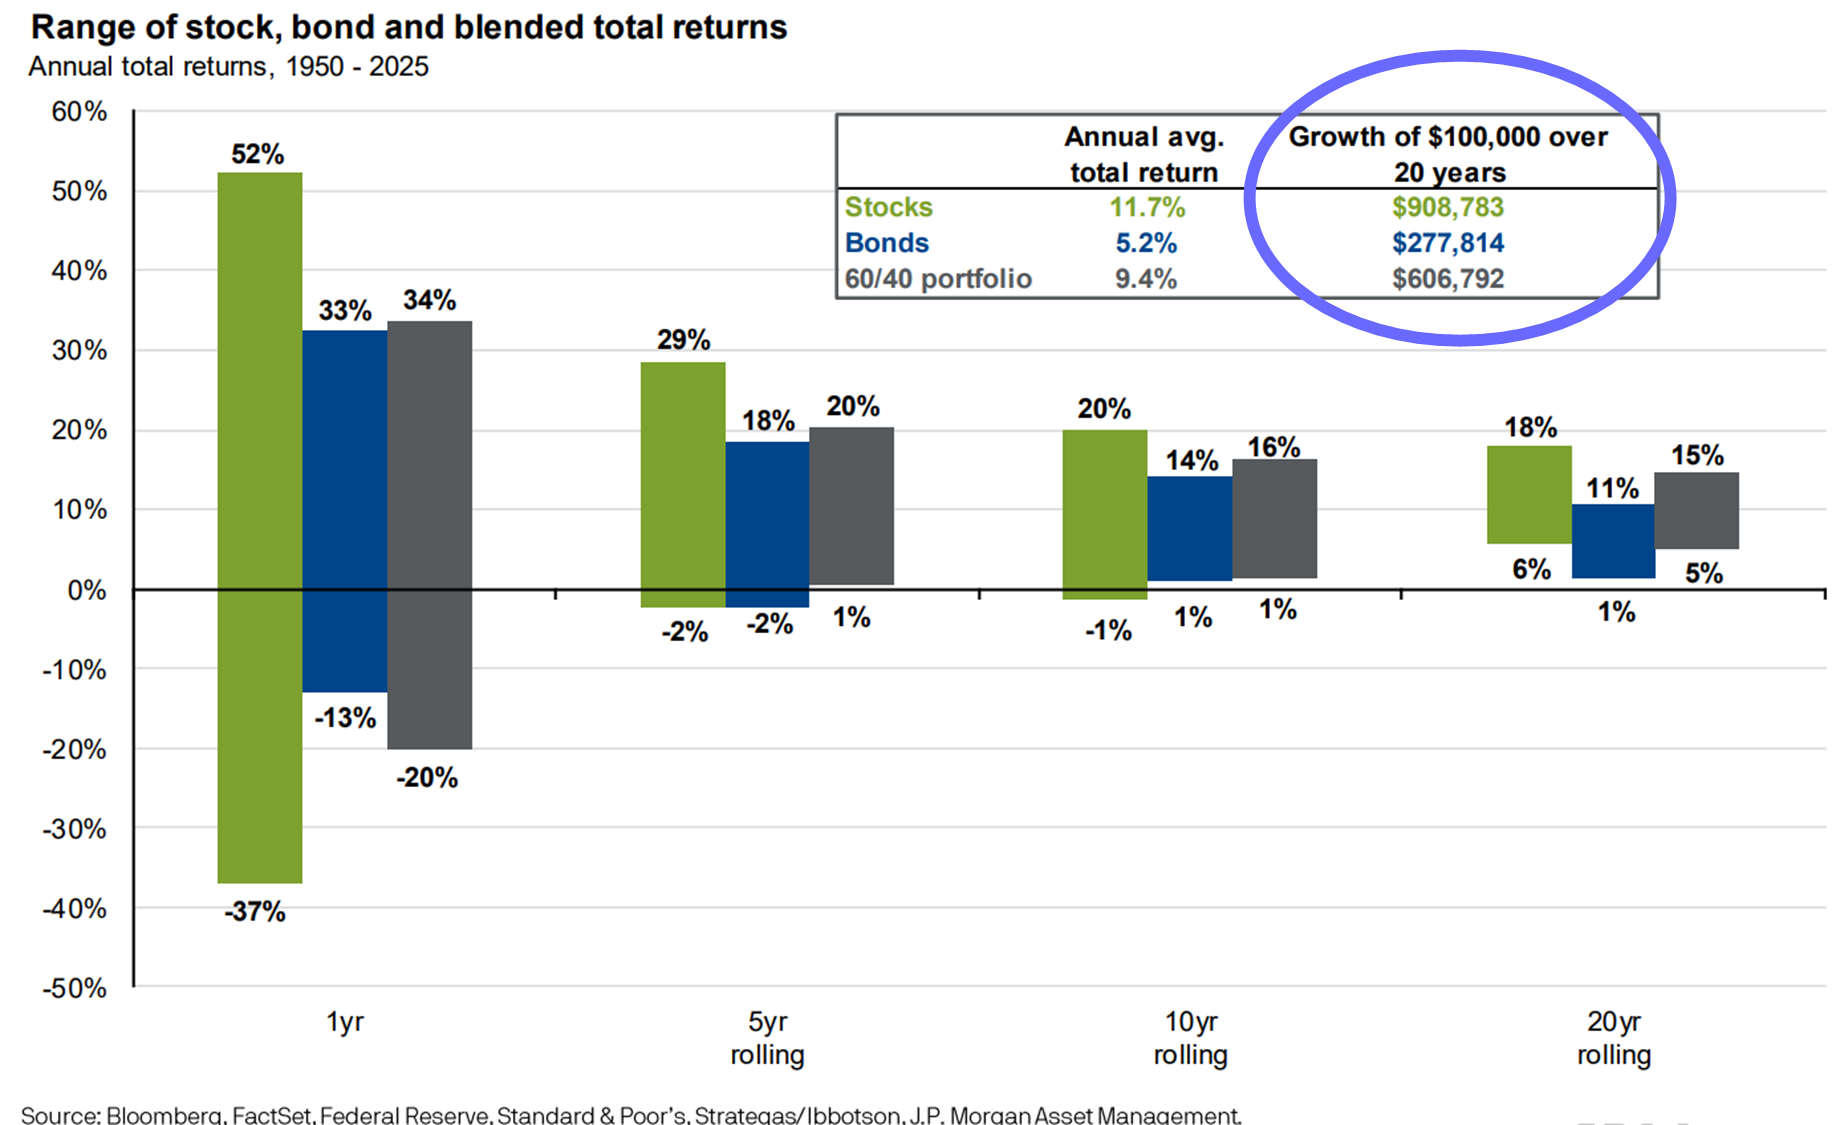
So depending on your need for short-term liquidity (spending cash), you may want to adjust your asset allocation to include more bonds (or even money market funds) and/or more stocks to benefit from the sneaky power of long-term compound growth. This is where you may adjust your asset allocation from 60/40 to 50/50, or 90/10, depending on your own individual investment situation and goals.
Long-Term Compound Growth
And to help you further conceptualize this tradeoff between stock returns and bond returns (becuase the annnualized return comparison graph provided may not do it justice in your mind (it masks the power of compound growth—or growth on top of growth), here is a look at the total returns for US Stocks versus US Bonds (ETF tickers VTI and BND), since just prior to the “Great Financial Crisis” (GFC, aka “Housing Crisis”) in 2007 through the year 2025.
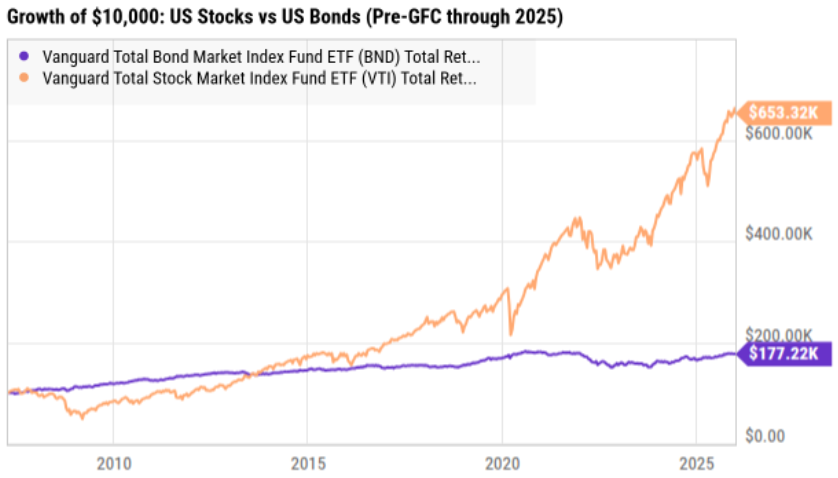
As you can see, if you held 100% stocks (the orange line) going into the GFC back in 2007—you lost A LOT of money in 2008-2009. Whereas if you held 100% bonds (the purple line)—you did significantly better. However, if you had the wherewithal to hang on to your stocks for the long-term (10+ years) you did dramatically better (i.e. the power of long-term compound growth kicked in).
This example illustrates the risk-reward tradeoff and the power of long-term compound growth. In plain terms, if you have significant cash needs in the next few months and years—it’s probably a bad idea to own 100% stocks. But if you have the ability to hang on for the long-term—compound growth (growth on top of growth) is the 8th wonder of the world. Specifically, a $100K bond investment only grew to $177.2K over this period, but the much more volatile stocks grew to over $653K—that’s a big difference! In fact, it’s life changing for a lot of people.
The bottom line: Know your own personal situation, and do what is right for you.
Asset Allocation & Returns
Asset allocation is one of the few investment decisions that can matter more than individual stock picking. Over long periods, the split between stocks, bonds, cash, real assets, US, and international markets often explains more of a portfolio’s behavior than whether an investor owned one company or another.
The relationship between stocks and bonds changes across eras. In some decades, bonds act as shock absorbers when equities fall; in others, inflation pressures can push both down at the same time. Investors often discover that diversification is not a permanent law of nature — it’s partly shaped by the macroeconomic regime of the period.
Particular investment styles can completely dominate market returns for surprisingly long stretches, which often convinces investors that diversification is unnecessary. The challenge is that diversification usually feels least useful right before it becomes valuable again.
Even 100% passive portfolios (such as popular ETF target-date funds) end up making huge structural bets on the future shape of the economy.